In my recent study, I explored that Grafana not only helps users visualize performance metrics but also helps users to query information from a number of data sources; for example -MySQL. This encouraged me to further research and evaluate the tool and its connectivity with MySQL. It was worth an experiment and hence sharing the lessons in this blog.
Pre-requisites: Grafana and MySQL are installed and configured
Scenario: Display data from MySQL in Grafana. MySQL comprises of two tables (‘employee’ and ‘pay’).These tables have employee data and their respective reward points collected per month. We will extract data from both these tables and display the rewards granted per month in Grafana. As an example, we will leverage following query to get the data –
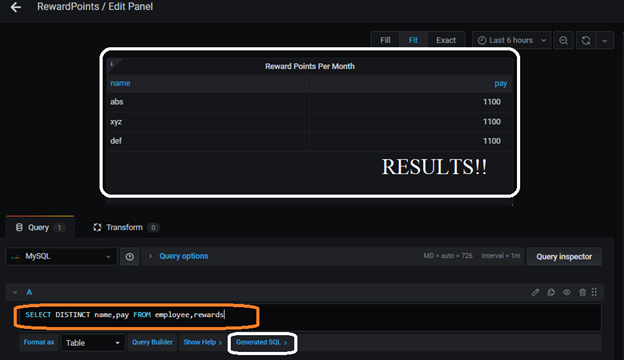
“SELECT DISTINCT name,pay FROM employee,rewards”
The above query returns unique records of employees and their reward points.
Steps followed-
Step 1 -> Login into Grafana
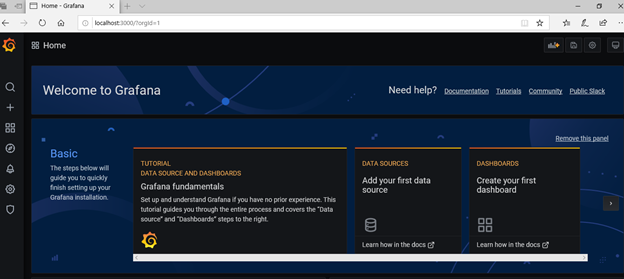
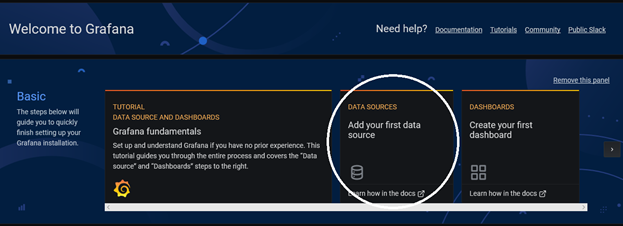
Step 2 -> Click on DATA SOURCES to add MySQL database as the source of information.
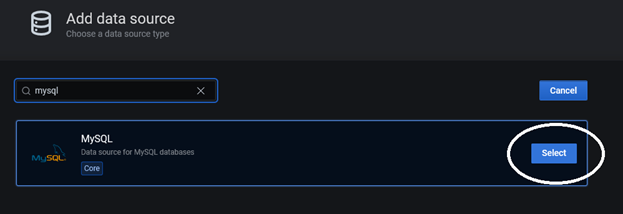
Search for the MYSQL DB plugin and click on SELECT button as shown below-
Step 3 -> Now, we will configure the settings for this data source.
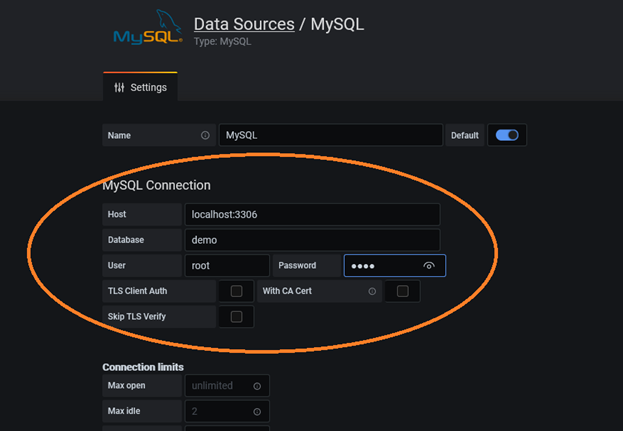
Test the configuration –
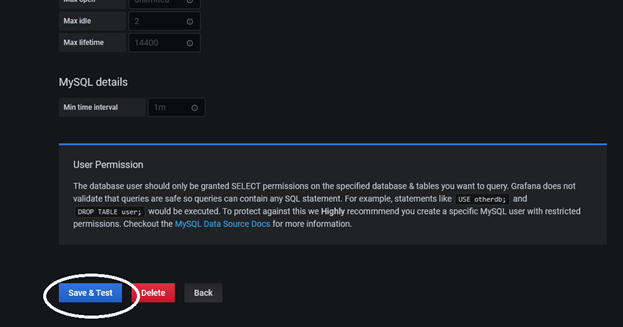
If the connection is successful, you will receive the following notification-
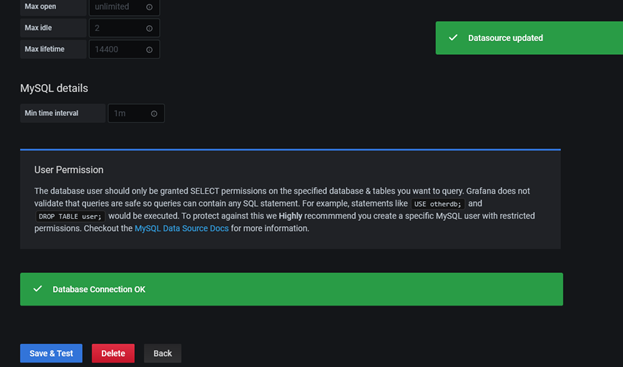
Step 4 -> Click on CREATE NEW DASHBOARD to fetch data from the configured database. Select the option to create a dashboard and a NEW PANEL as displayed below-
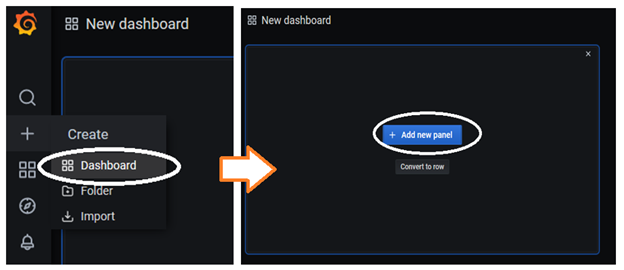
There can be multiple panels on a single dashboard. Each panel needs to be configured. The following steps 4.1 till 4.3 describe the settings that are to be configured.
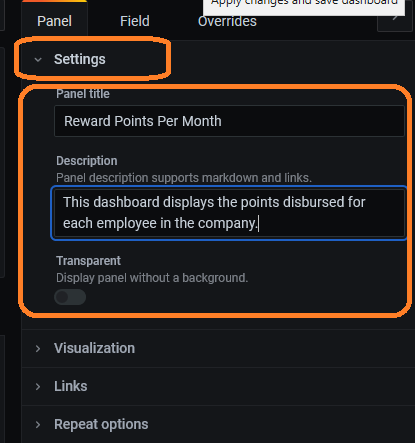
Step 4.1 –> Define SETTINGS (visible on right window pane)- Give a name to this new panel/section and describe it. For our example, lets name this section as “Reward Points Per Month”.
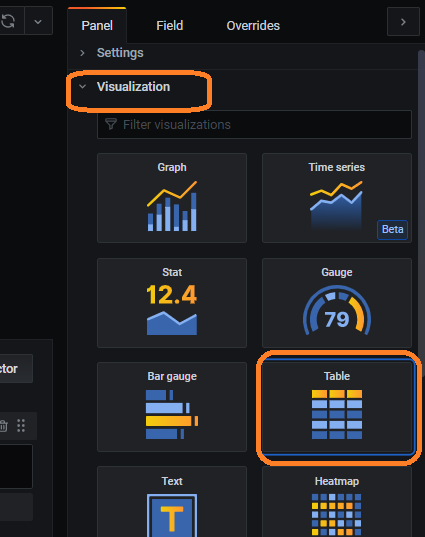
Step 4.2 -> Select ‘VISUALIZATION” (visible on right window pane, below the Settings option)– Now expand this menu to select the type of data display. Let us select “TABLE ” for our scenario-
Step 4.3 -> Define the QUERY (visible at the bottom window pane) – embed the query and execute to view the results as shown below –
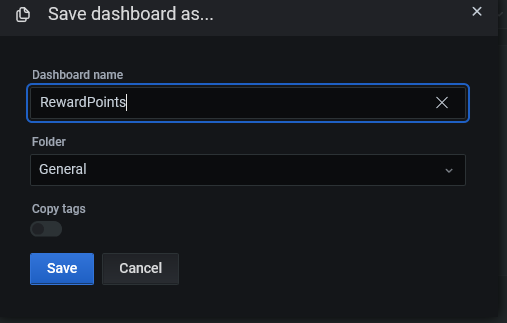
Step 5 -> Once the configurations are done, SAVE the dashboard. Lets name it ‘Reward Points’-
This dashboard now displays the following panel that shows DATA from MySQL tables–
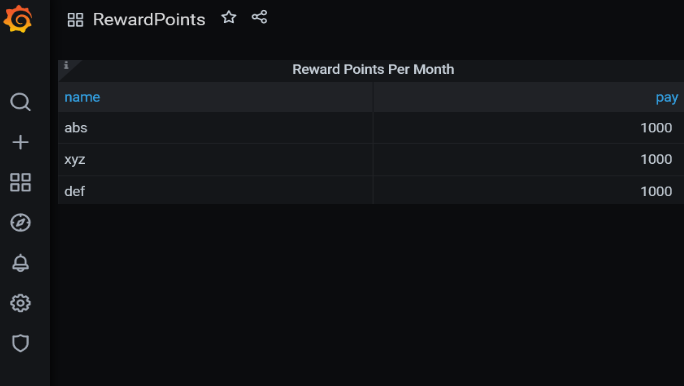
That’s it.. we have our first dashboard in Grafana that displays data from MySQL. And in fact this is an easy example to get started for beginners. You can try this out and work with different SQLs based on the requirement.
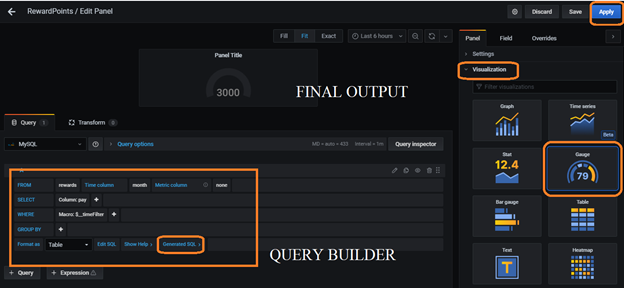
Extending the scenario – Let us try adding another panel on this dashboard, this time we will add the panel and select “GAUGE” visualization setting. Let us assume we need to display the total rewards granted so far. You can either write the query as we did earlier or use the Query Builder to design the SQL. As shown below, just insert a new panel on the same dashboard, mention the query, select the visualization form as Gauge and then save and apply this new panel.
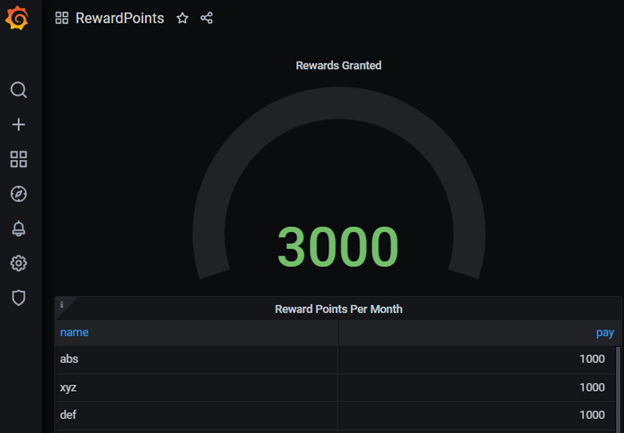
The updated dashboard will now display both the panels –
Summary–
Grafana definitely is a user friendly tool and offers a number of options to display data. While the key focus majorly is on time series data like displaying performance metrics (which we will cover in our next blog) but it also offers capability to display data either in raw form or in an aggregated form.
Are you too using Grafana? Do share in your experiences and learnings.
References-
Differences between Grafana vs. Kibana vs. Tableau – well known DVT tools!!
