An important aspect of delivery is to bring in visibility on the work status as well as on team performance. And Jira Dashboards are a perfect example to serve this purpose. Dashboards are a medium that helps teams to view as well as track deliverables and project status. Every dashboard comprises of GADGETS – these are placeholders that display specific information and can be configured to display dynamic content in regular time intervals. There are different types of Gadgets available in Jira and it is important that the relevant ones are selected timely. Once you login into Jira, by default you get to see the “System Dashboard”; that displays default information like issues/tickets that are assigned to you and also on-going project updates.

But what if you are in charge of creating a Custom Dashboard for entire team, let’s learn on how to create one such dashboard-
Step 1 -> Login into the JIRA and click on the Dashboards link displayed on the top panel as shown below-

Step 2 -> Click on the “CREATE NEW DASHBOARD” button displayed on top right corner-

You will be prompted to share the name for the custom dashboard followed by the requisites like description, template and the access rights to be granted for viewers and editors.
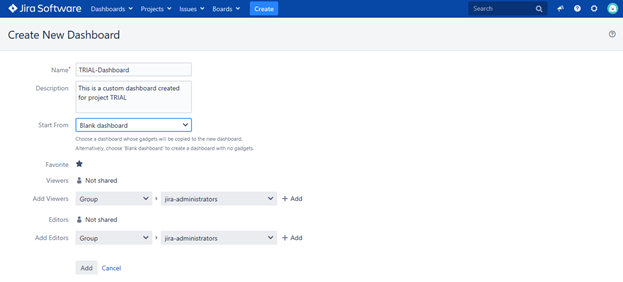
You can modify user access to this custom dashboard anytime later as well. In case you need to add any user, then mention the group type followed by the access type as shown below-

For this example, we will name the dashboard as “TRIAL-Dashboard”, which will display information for the project created TRIAL (refer chapter 3). Click on the ADD button to create the new custom dashboard.
Note– You can refresh the dashboard properties later as well as visiting the “Manage Dashboard” option.
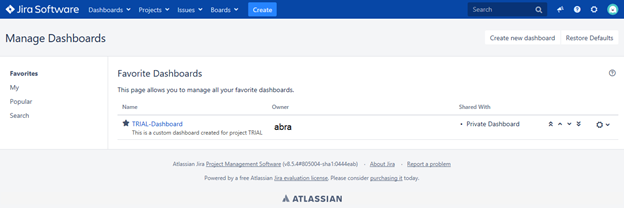
Step 3 -> The new custom dashboard is empty, we need to add gadgets to this dashboard. Click on the “ADD A NEW GADGET” option as shown below-

A window opens up, displaying default gadgets, click on “LOAD ALL GADGETS” link-
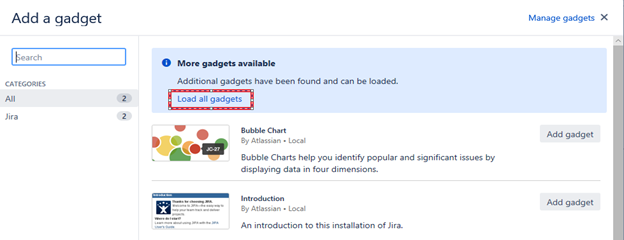
You can also search for a particular gadget by typing in its name in the search box as visible on the left panel. For our example, lets insert a PIE CHART by clicking on the ADD GADGET button as shown below
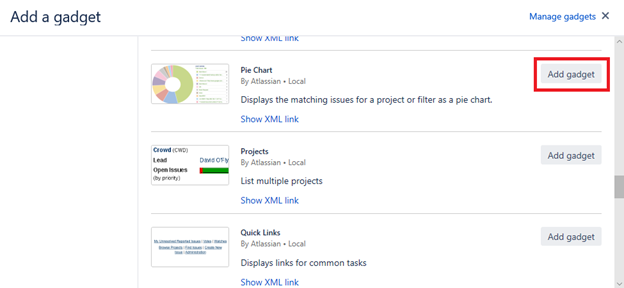
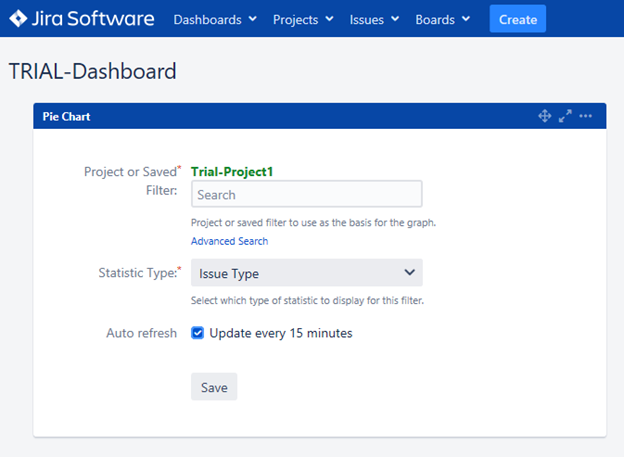
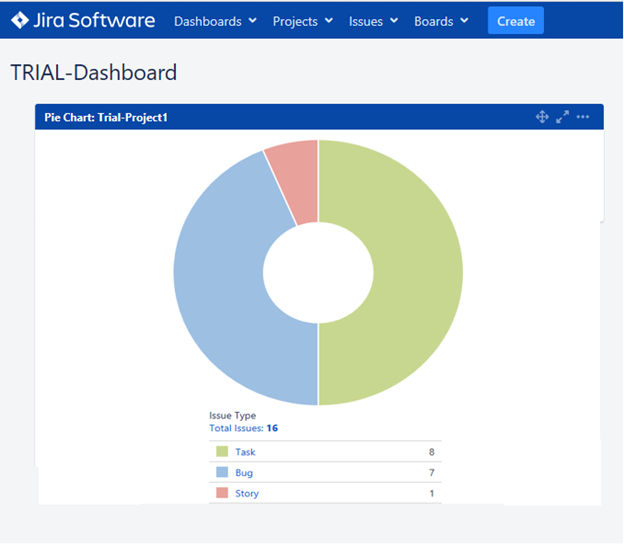
Close the window to proceed. Now, you need to configure the Pie chart with the project information that it should display. Search for the project name – TRIAL-PROJECT1, mention the Statistics type like on what basis the data should be collected – by default it considers Assignee, you can change it as well. For this example, we have selected ISSUE TYPE (to view number of Bugs, issues, Tasks). You also have the option to select the time interval for refreshing this widget. If you click on the option “UPDATE EVERY 15 min”, then this widget will retrieve the latest information every 15 minutes and display the values. Once the values are configured, click on the SAVE button.
Post saving the widget, the custom dashboard will display the Pie Chart based on the existing data from TRIAL-PROJECT1-
The process explained above is just one way to insert gadgets by configuring with projects. There is another way as well – which is by querying. You can create queries, save them and then configure them with the gadgets. We will focus on creating a query-based widgets in our successive chapters.
That’s was easy and fast, isn’t it?? You can add as many widgets as needed BUT ensure that you focus on what type of information is needed. The custom dashboard created is a Private one, which will be visible only to you. Once the dashboard is ready, you can make it Public or share it with specific team members (by visiting the Manage Dashboards option).
As a Scrum Master / Agile SPOC, you should focus on some widgets that are useful for entire team like-
- Pie Chart = view list of tasks, bugs, stories, etc or view team member wise workloads
- Burn down chart = view team performance
- Issue Statistics = view number of issues across projects
- Sprint Status = display sprint cycle – days remaining, duration, status etc
There might be more… but remember that team dashboards should be simple to refer and interpret!!

