In my earlier post, I had walked through the steps on how MySQL table data can be displayed in Grafana. In this blog, I will share steps on how MySQL performance metrics can be displayed in Grafana too. While there are a number of performance metrics available to track a database; the intent is to proactively detect anomalies in the database and take appropriate action.
Pre-requisites:
1.Grafana (v7.4+) and MySQL (v5.1+) are installed and configured
2.Setup a MySQL statistics collector, refer my2Collector – https://github.com/meob/my2Collector (download and run this my2_80.sql script). The scheduler will insert values in the “status” table inside the “my2” table.
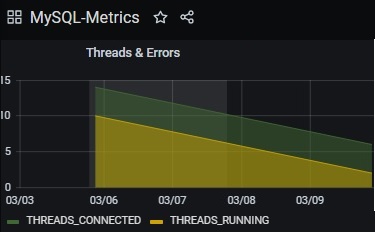
Scenario: We will explore and view two database statistics – THREADS_CONNECTED and THREAD_RUNNING on a graph in Grafana. Let us get started!!
Step 1 -> Check for MYSQL databases (run the command ‘show databases’ in MySQL Query Browser) post running the sql file (as mentioned in pre-requisites).
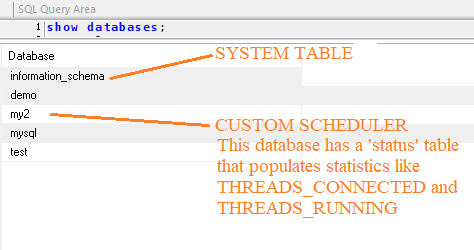
The ‘information_schema’ database stores metadata for all the databases in MYSQL (available from V5.x+). At regular time intervals, data from this table is picked and then inserted into the MY2 database that has a table called “status” with timestamp. We will refer this “status” table in Grafana.
Step 2 -> For tracking MySQL metrics, we would need to install a metrics plugin. There is a MySQL Metrics plugin available that can be used.
Just download and save the JSON file from the given site on your local system- https://grafana.com/grafana/dashboards/4039.
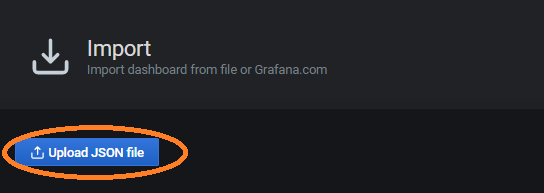
Step 3 -> Access Grafana and click on IMPORT option from the left panel as shown below to upload this JSON (that is downloaded in Step 2)
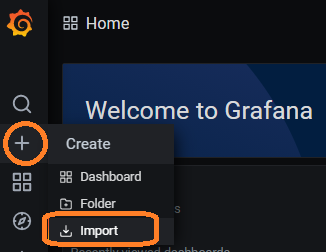
Upload the file that was saved in your local system-
Name this dashboard-“MySQL-Metrics” and click on SAVE. This generates a metrics dashboard as shown below-

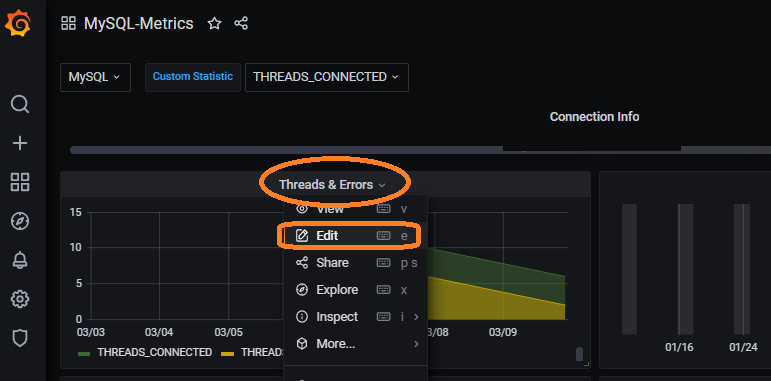
Step 4 -> You can edit each widget on this dashboard. Just click on any widget and select the option EDIT as shown below-
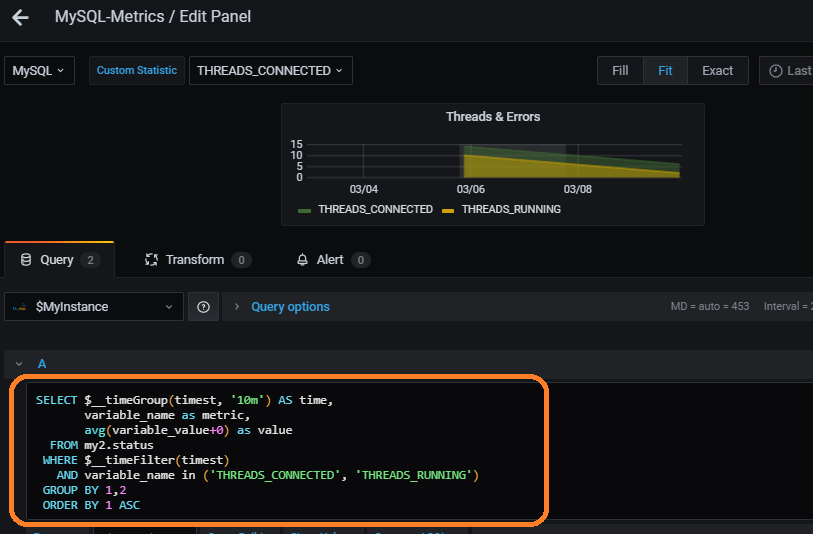
You can view the SQL statement and how data is being displayed on the graph. As in the snapshot below, you will observe that the values for the variables THREADS_CONNECTED and THREADS_RUNNING is selected from the my2.status schema and is displayed on the graph.
You can easily edit/add/remove panels as needed. Wasn’t this easy 🙂 I enjoyed exploring the metric plugin and made some customizations as well.
Is there another way that we can configure?? Do share in your research !!