Jira Metrics – Chapter 10
It has been an interesting journey so far studying Jira, we scrolled across various concepts like Project Workflows, Customization, Dashboarding, JQLs, and JIRA APIs. Let us look at another interesting concept in Jira which focuses on METRICS. If you are a Scrum Master or an Agile PM, you must be struggling with few important questions like –
(1) How much work was accomplished in a set duration?
(2) How much time it took to complete a task?
(3) How many issues occur during the timeframe?
(4) How many deployments were done during the period?
(5) How was the team and customer engagement and their morale/satisfaction levels?
And Metrics comes to rescue ………. it addresses the above questions. It is used to track and assess the status of process workflows and helps Scrum masters or Agile PMs to make intelligent decisions. Let’s see some Key Project Metrics that may help you for tracking your Jira Projects.
Kanban Projects–
- Throughput : Number of Cards (Tickets/Tasks/User Stories) delivered in a given period of time or Sprint
- Lead Time : Time taken to complete the task , from the time the task was requested to the time it was completed and delivered
- Cycle Time : Actual time taken to complete the task excluding the wait time.
Scrum Projects-
- Velocity : Total number of story points executed by the team in the sprint
- Burn Down Chart : It’s a metrics / information radiator which depicts how many story points have been completed from planned for current Sprint.
The above metrics are generated as reports which can be added as a gadget on the dashboard as well.
Creating Velocity Chart
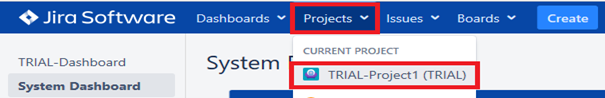
Step 1 -> Access Jira and the TRIAL-PROJECT1
Step 2 -> Click on the REPORTS icon visible on the left panel as shown below-
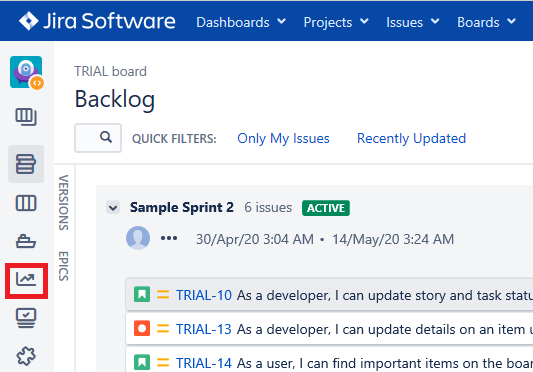
You will be able to view all the Reports for this Scrum project. Click on the VELOCITY CHART –
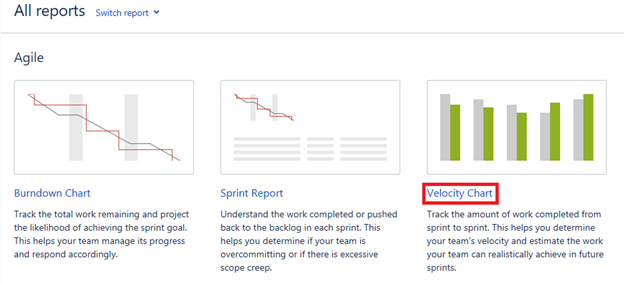
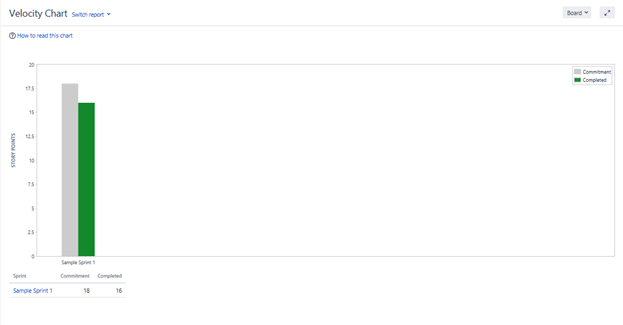
A Velocity Chart displays the story points which were planned and complete for a particular sprint – for example –
Creating Burndown Chart
Step 3 -> On the same Reports section, switch to the BURNDOWN CHART option as shown below-
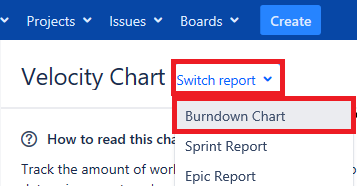
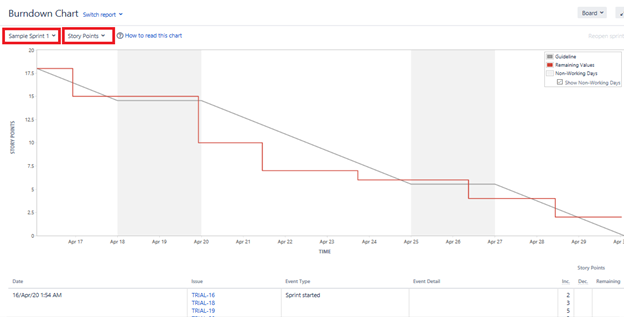
A Burn down Chart shows day by day team progress for current / previous sprint.
Creating Control Chart
Step 4 -> On the Reports section, select the CONTROL CHART option as shown below-
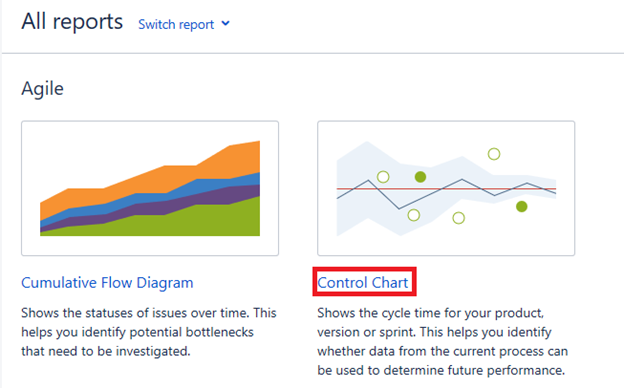
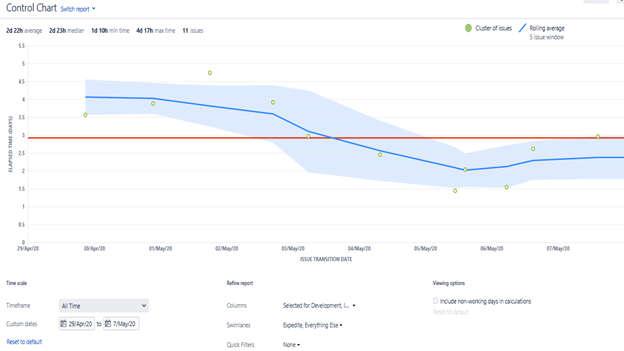
A CONTROL CHART shows team performance over a time period like over a week or over a month.
Apart from these Jira Agile charts, there is another way to prepare metrics especially for Kanban projects through Filters along with Time in Status Plugin. ‘Time In Status’ is a paid plugin and does not come with JIRA Installation. It has various reports, out of which Status Time helps to show how much time the issue was in a particular status. This helps in understanding flow of your ticket and identify time consuming process or bottlenecks in the workflow.
As a Scrum Master / Agile SPOC you will need to prepare and capture Metrics where these charts and filters will be very useful. As a best practice, capture only what you want to measure and use it for improvements in your process and quality of deliverables. Adding too many metrics becomes cumbersome and non-value add activity 🙂
So, get started and share your interesting reports / charts that’s been helpful for your teams!!

Agile Ops Series