So far as so good with the Google Looker Studio. Right from building first report, to adding multiple data sources) and then blending multiple sources (blending data sources); the Looker Studio has so much to offer allowing users to quickly create interactive reports. My past blogs introduced the platform and how we can get started easily. But reports cannot be simple, we need to be creative with the reports and add color to them.
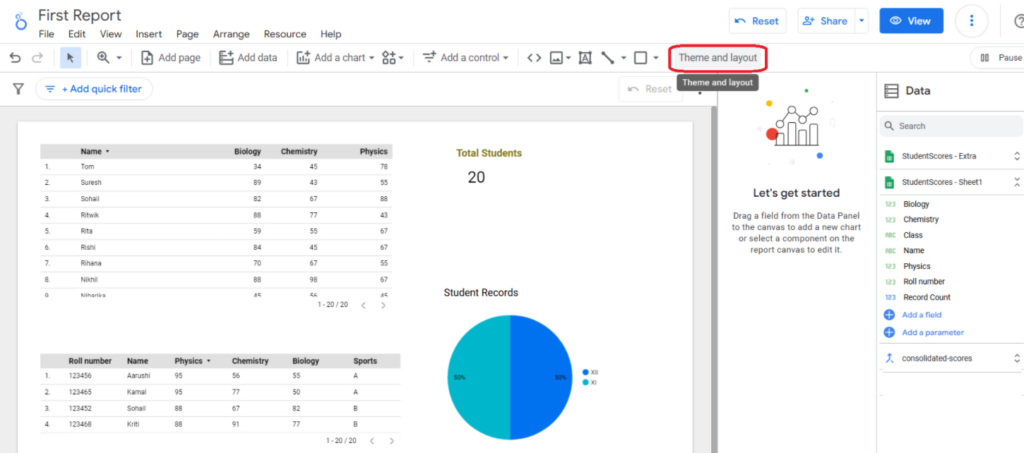
In this Part IV of the series, I will share few quick tips on how themes and layouts can be applied. Let us open our First Report (in the EDIT option). Click on the button named “THEMES and LAYOUT” as shown in the Image 1.
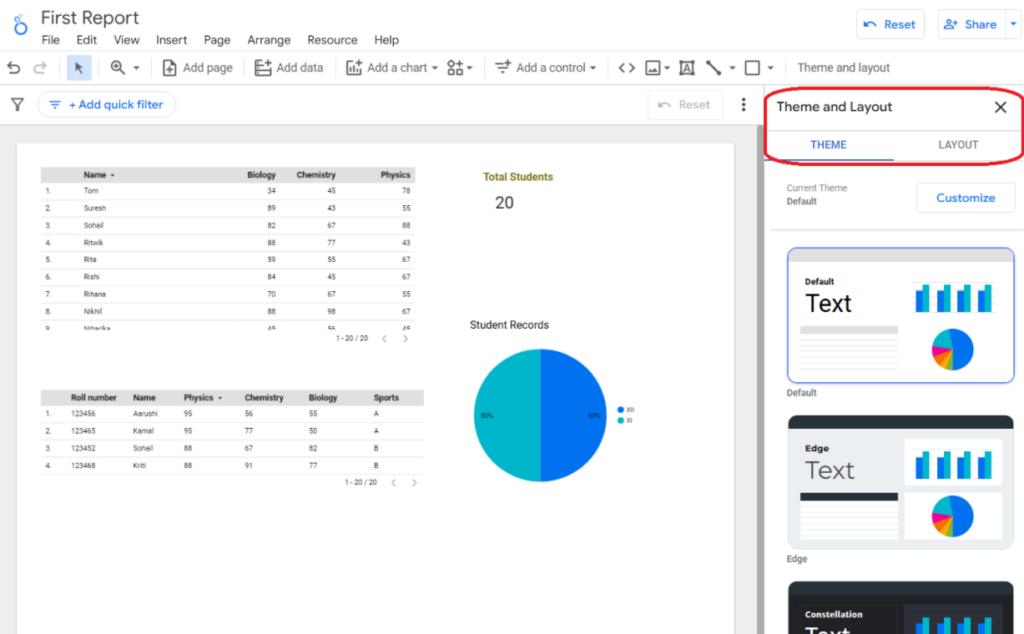
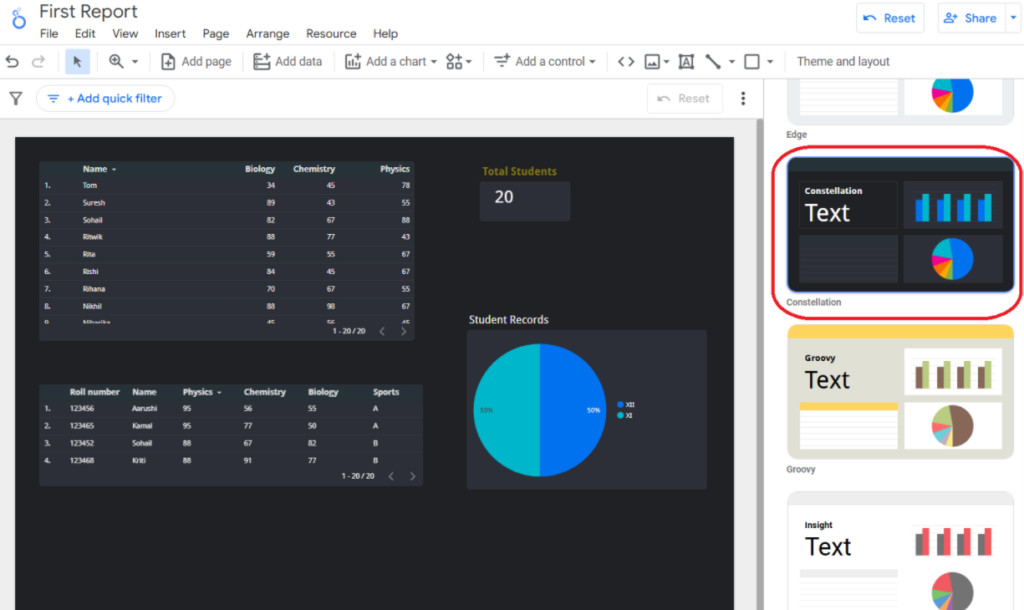
The window panel opens up on the right side showing two tabs – Theme and Layout. The Theme tab offers templates that can be quickly applied to the report. Let us try the theme named “Constellation”. Do try out other available themes.
You will see that the report reflects the theme as shown in Image 3.
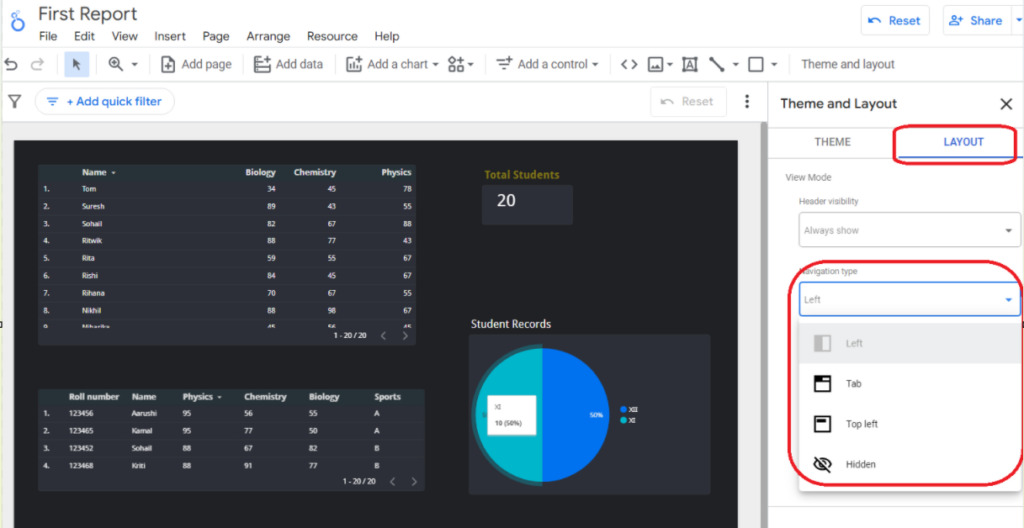
Coming to the Layout, click on the layout tab. This tab offers options to re-define display mode(fit to width or actual size), view mode (this is with respect to viewing report name/s on either the left side or on the top). You can click on the drop down boxes to view options. For now, we have just one report; so the view will not be relevant.
Close this Theme and Layout window and look out for the left panel to view the report name. Currently, we have only one report. Let us add a new report to this project and refine the layout styles.
ADDING A NEW REPORT
Step 1: Click on the button “ADD PAGE” as shown in the image below-

Step 2: This will open the “Report Pages” panel on the right side where you will be able to view two reports now. Both reports are named as Untitled. Earlier there was just one report called First Report but now we are adding multiple reports, so we need to individually rename them.

Step 3: Click on the ellipsis option against each of the report names, select the option to “Rename” and give them new names.
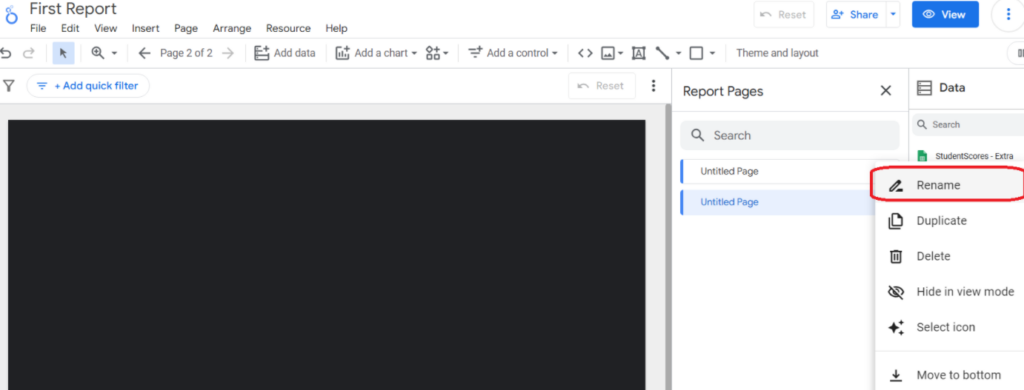
The first report that we created – let us name it “Sample Report 1” (the student report) and this new report that we have added, let us name it “Sample 2”. Take a look at Image 8 below-

You can anytime, click on any of these report names to navigate between reports. Our first report (Sample Report 1) showed student information.
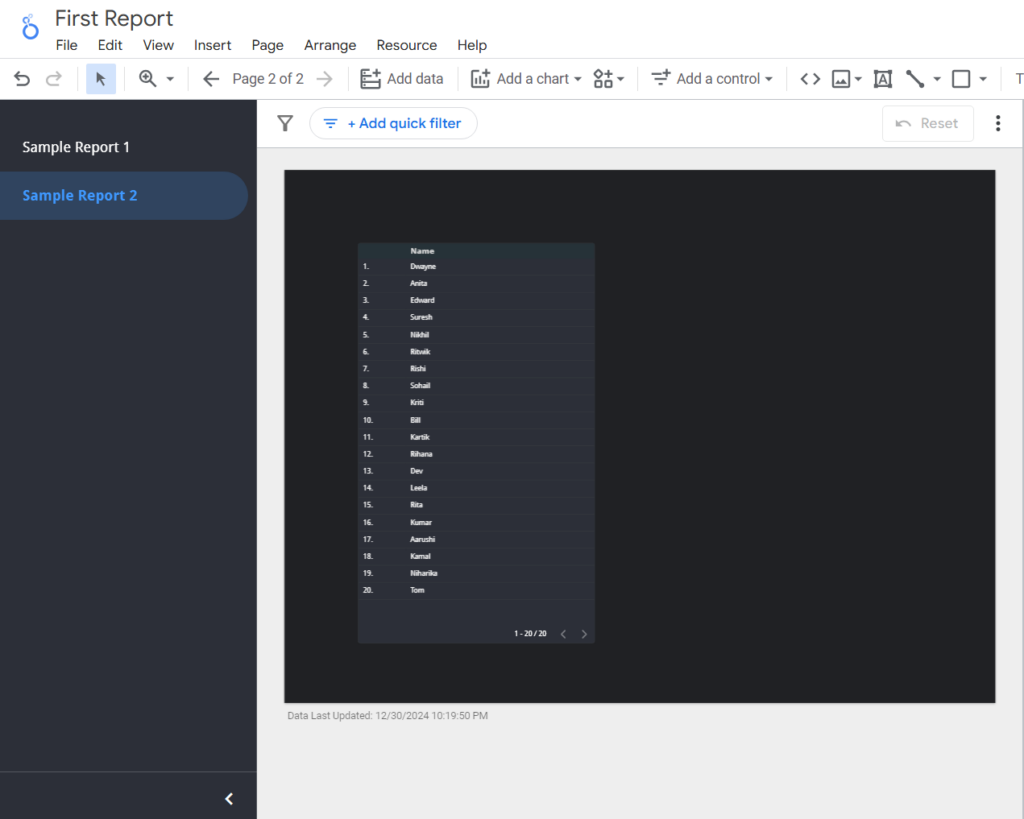
Step 4: Now, for the second report, we will use the blended data source to quickly publish some data points. Just drag and drop the name field to be displayed in a table format, Do note, the second report that we added is a new report and is blank (but follows the consolidated theme pattern).
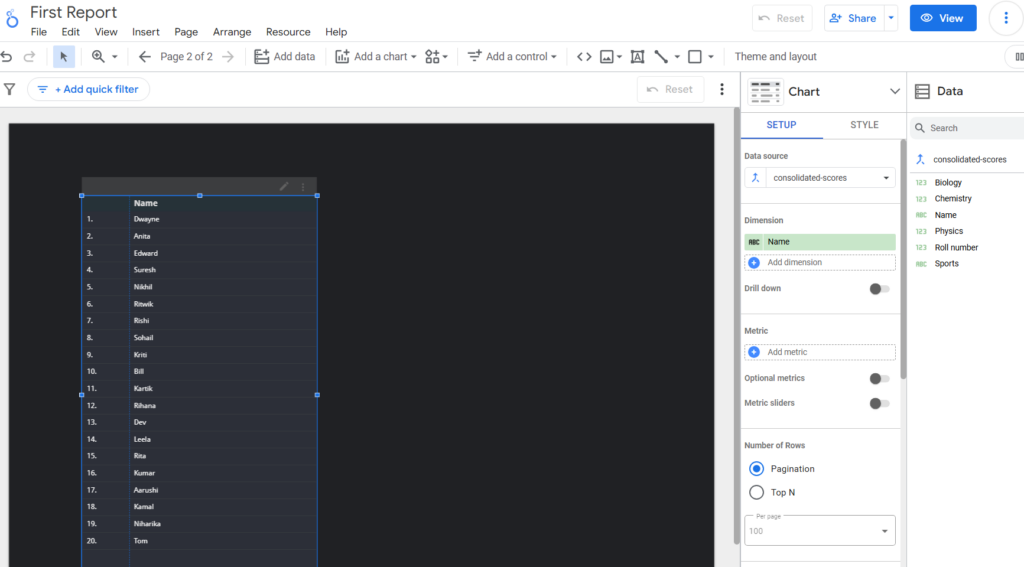
Now, we have two reports. You will see an arrow now visible on the left bottom corner as shown in below image 11.

This is the navigation panel (left side) that displays the reports. Since we have two reports, it will display the options 1 and 2 and also the arrow option.
Once you click on this arrow option, the panel will expand and show you the report names. Remember , we had the Report Pages panel which was the right side- this is used to add, rename reports. And the one we can referring to currently (image 11) is the navigation panel on the left side of the report.
You can click on any of the reports, to view the report. This is in edit mode.
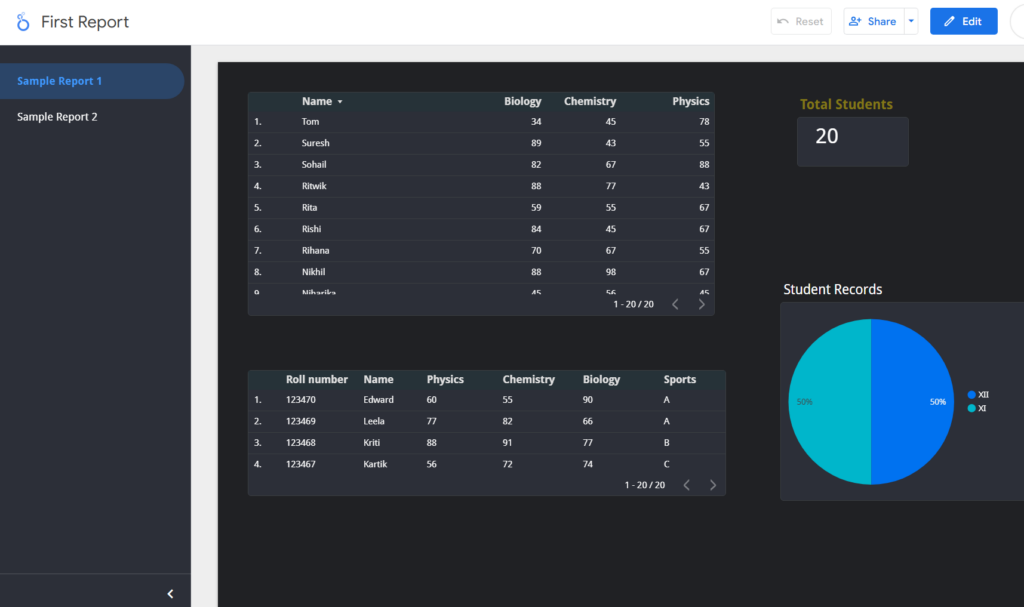
To view the report in readable format, click on the VIEW button on top right corner.
Now, instead of the report names being displayed on the left panel you wish to view it on the top as tabs. All you need to do is switch of a different layout. But for this, let us switch back to the EDIT mode.
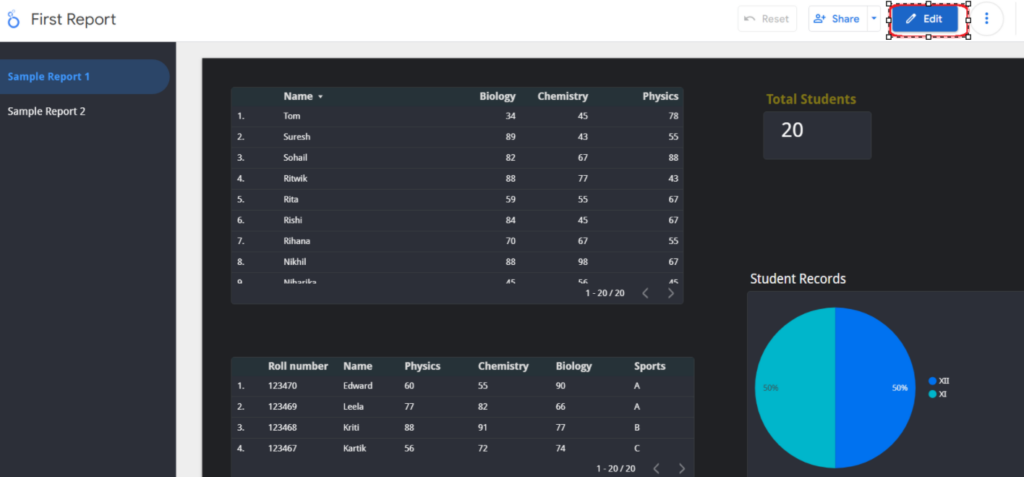
When the report is opened in the EDIT view, click on the “Themes and Layout” button again, this time click on the LAYOUT tab to change the display option for the reports.
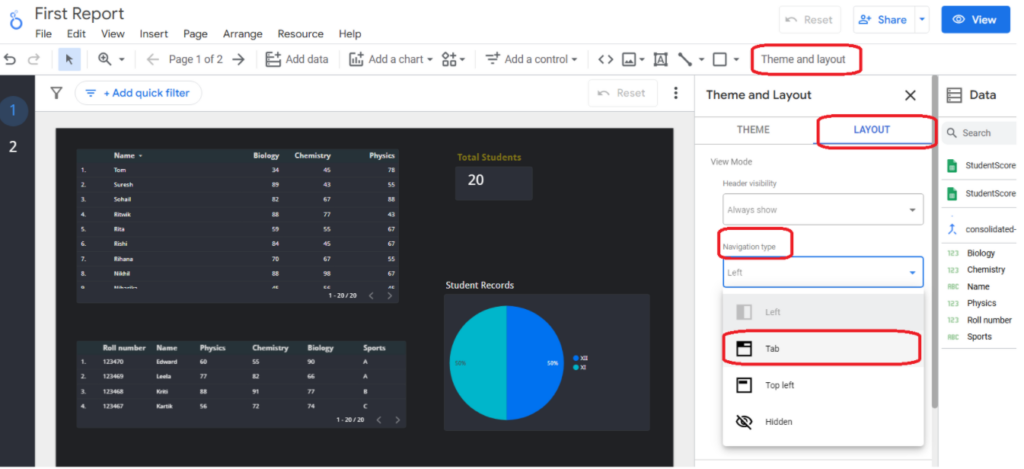
Once the changes are done, you will be able to see the report names as tabs now, as shown in Image 16.

Summary
So, there you are with a Looker project comprising of two reports. Each of them following a theme pattern and being displayed as tabs. Anytime you can switch to look at the report in VIEW mode or switch to EDIT mode to making changes to the report.
Things that one can further explore and implement-
a. try adding text on the report (Insert menu -> Text)
b. change the font color
c. add names to each of the wdigets
d. align the widgets with a defined style, adding margins
..well.. there are many more things that one can start adding on the report. We just need data sources and the target vision; meaning what data is to be presented and in what format (whether it has to be tabular or a pie chart or a scorecard, etc).
In the upcoming blogs, I will share advanced tips on how we can add aggregated fields (click here to read on how to add aggregated/calculated fields), hyperlink the reports and perform group calculations.
Stay tuned !!
