As we explore Looker Studio, we realize that there are many interesting options that teams can leverage. The initial parts of my blog series was focusing on the simple aspects of using Looker Studio – building the simple report (Part I) and then adding more data sources (Part II). Let us now consider a scenario where we have data in two sheets (referring them as two data sources) and we would like to consolidate the data sources.
Remember the two sheets we have in our Google Sheets – they refer to same set of students and stores their subject grades for primary and secondary subjects (like sports). Also, when we created widgets, each one was connected to one data source at a time. What if we would like to publish data only for those students whose roll number matches in both the sheets (I mean both the data sources. Like we need to publish a report that displays the roll number, name, grades for Physics, Chemistry, Biology and Sports; all in one table. This is possible in Looker Studio with the process of BLENDING. Remember, JOINS in our SQL world?? Yes, we will create a new data source that will blend the data from both these data sheets as one data source for us (and roll number will be common field that will help us blend the data).
Steps to blend data in Looker Studio-
- Create a blended data source (mentioning the type of join needed)
- Select the fields from the tables
- Configure the join
- Name and save this blended data set.
- Publish the blended data as a table on the report.
Working with joins is always interesting, isn’t it? Let us deep dive on how we can achieve this in Google Looker Studio.
Step 1: Create a new blended data source
Click on the menu “RESOURCE -> MANAGE BLENDS” as shown below-

Click on the “Add Blend” option on the new window to begin the process.

Step 2: Add fields for blending
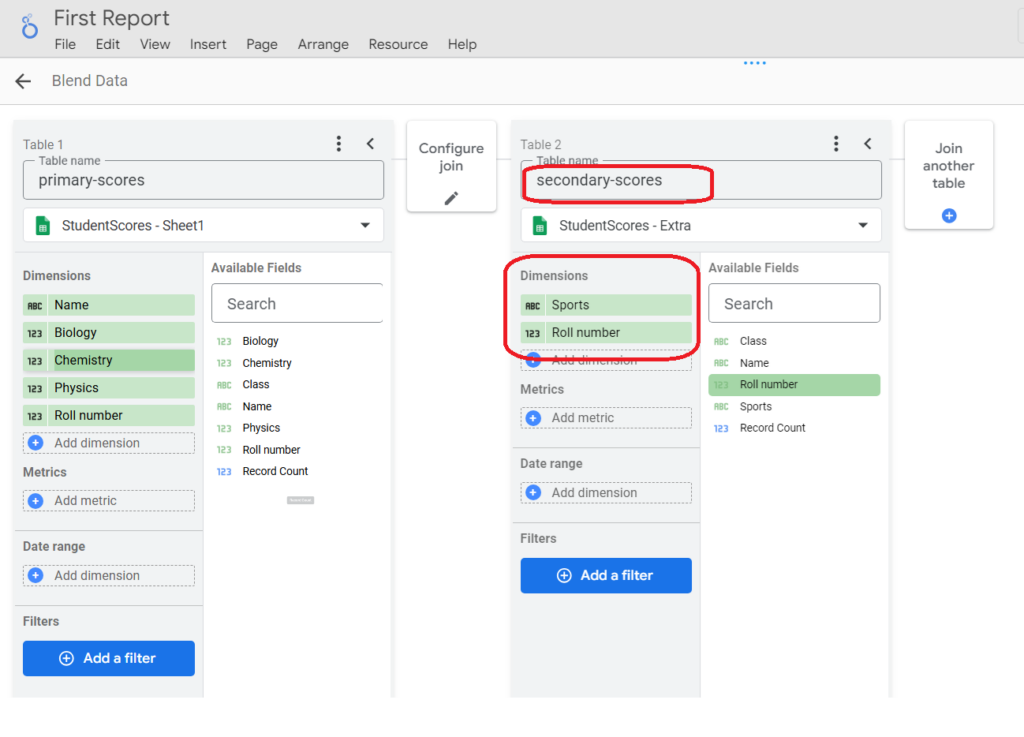
By default, the window will display one of the existing data sources as Table 1, name it as “primary-scores” and drag and drop the roll number field, the name field and subject fields under the dimensions section as shown below-

Now, this is our first table, we will now join this with the second table. Click on the button “Join another table” and select the second data source and give it a name “secondary-scores”. This time drag and drop the roll number field and the sports field on the dimensions section.
Step 3 : Configure the join between the two data sources
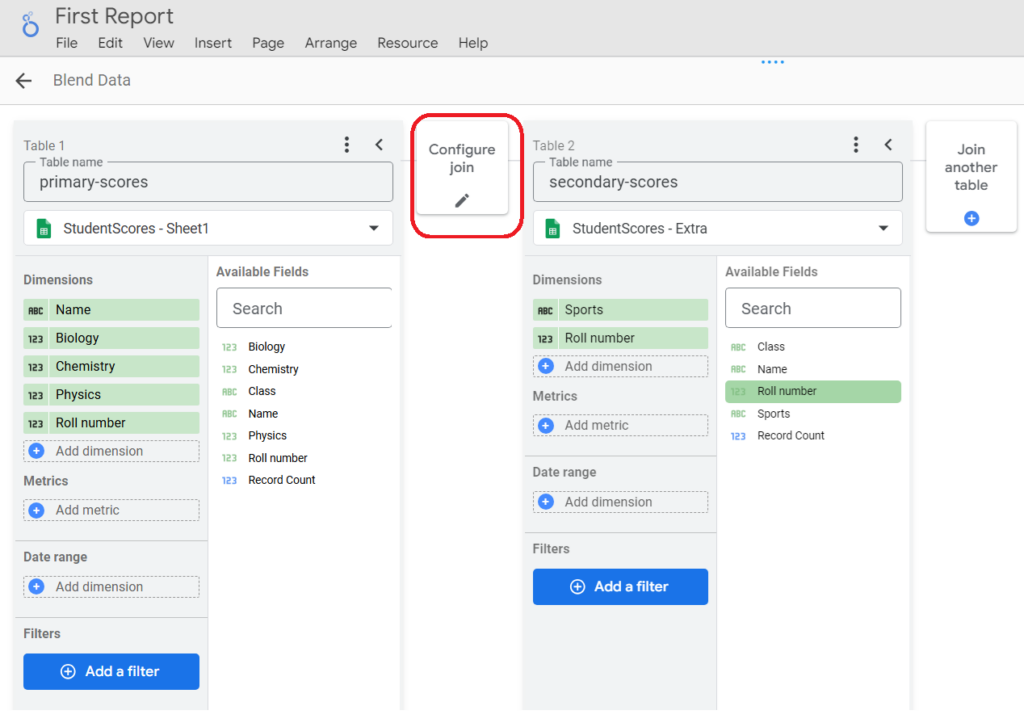
Now the next thing required is to configure the join between the two data sources. Remember both the sources have one common field – roll number. Ensure that this is available at both sides do that we configure the join between them. Click on the option “Configure join” as shown below-
I am sure when you will see the next screen – most of you will be able to connect with the type of joins – left outer join, right outer join, inner join, full outer and cross join 🙂

Select the join that best fits your situation – remember we want to blend the data based on roll number as a common field. Also, select the roll number field to serve as a the key field from both the data sources. Save the join configuration and proceed ahead with the blend. Our my example, I will select the inner join where I would like to publish scores for those students who have entries in both the tables/data sources.
Step 4 : Configure the join between the two data sources
Give a name to this blended source “consolidated-scores” and click on the save button and close this window.
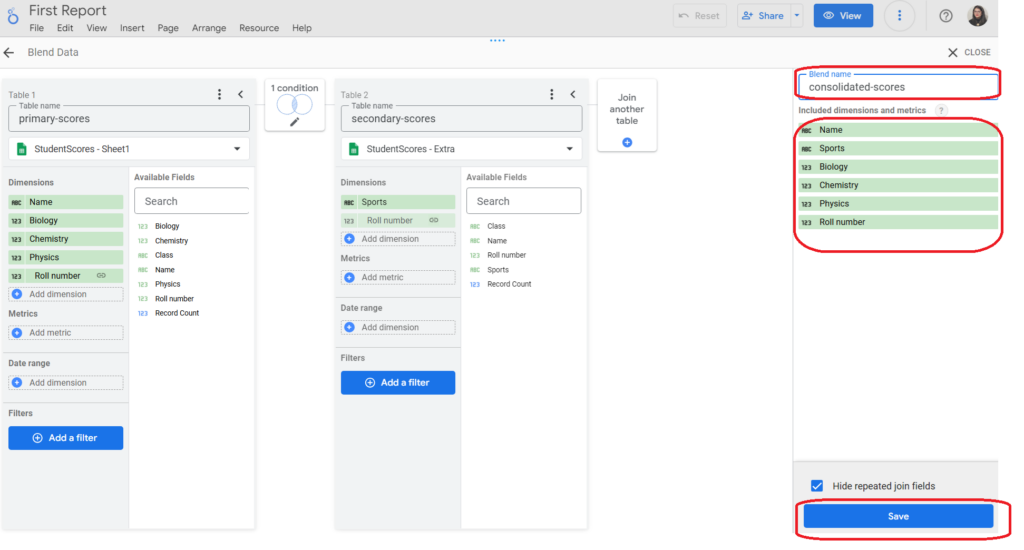
You will now notice, along with the two data sources that we had earlier, now we have this blended data source also visible in the DATA panel.

Step 5 : Publish the blended data as a table on the report.
Now, drag and drop the roll number field on the report area to setup a new table that shows scores for all subjects in one table. Remember, earlier we had tables created from the first data source, then we added the second data source and added that data. Now, we have the blended data that displays common records between both the data sources as one table, the table highlighted in green in the below image-

Summary
Blending is the process for consolidating data from multiple sources into one form. Do remember that Looker Studio allows a maximum of only five data sources to be blended. So, when should one use data blending in Google’s Looker Studio? Use this option for exploratory analysis. In the subsequent blogs, I will share my experiences on how can be further add new reports and change themes (click to read the new blog), and add aggregated metrics (calculations).
Stay tuned, but yes do share your comments if you are keen to explore any specific topic in Looker Studio !! Happy reporting !!!


