Google Looker Studio is a powerful visualization tool. I shared some of my experiences in the past blogs on how one can easily-
- get started with Looker Studio (building first report),
- add multiple data sources (connecting multiple data sheets on one report),
- blend data (using joins to merge data from multiple sources), and
- apply different themes and layouts (adding new reports, changing format, styling).
Now, imagine the same student sheet (Image 1), that was used as the data source in publishing the reports in Looker Studio. The sheet comprises of student grades with their roll numbers.

Now along with the student grades, wouldn’t it be awesome that the report publishes the average for each of the students in the report? So, now we get to view the student’s average score as well. Aggregated fields (also known as calculated fields) is like a breeze for addressing such scenarios!
Adding calculated fields in Looker Studio is also an easy process; let us dive into these simple steps-
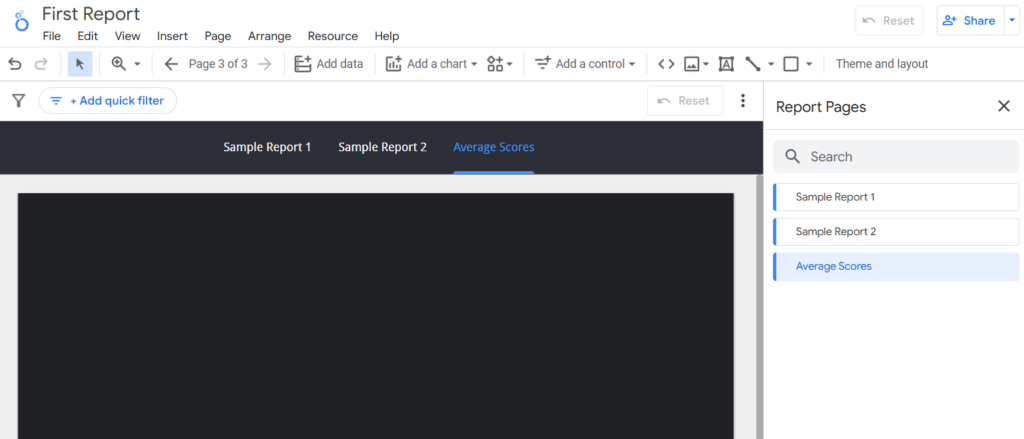
STEP 1: Open the existing report “First Report” in Looker Studio and add a new report this time, naming it as “Average Scores” (as shown in Image2). Do remember that when you open an existing report, it may open in View mode; you need to click on the EDIT button on the right top corner to switch to editing mode. If you need help on how to add a new report, refer the Part IV of this series – click here to read now.
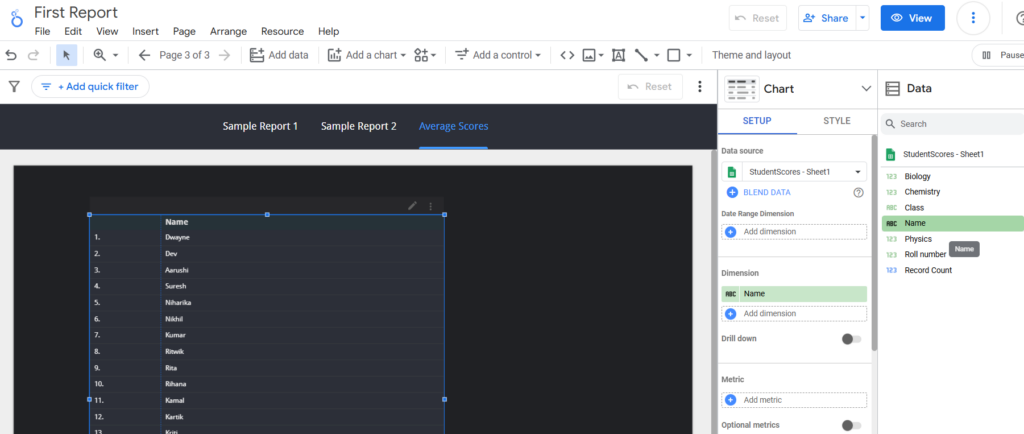
STEP 2: We have three data sources in the DATA panel (“studentscores-sheet1” primary grades, “studentscores-extra” secondary subject scores like sports and “consolidated-scores” blended data). From any one of the data sources, drag and drop the name of the student on the empty report (as shown below in Image 3).
STEP 3: Now, for these students, we will publish their average scores. From the DATA panel on the right side, you will notice an option at the bottom named as “Add a field”, click on this option. You will be prompted for more options, select the option “Add calculated field” as shown below in Image 4.

A new window will pop up that will ask for the name of this new field and the formula. Type in the name of this aggregated field as “calculate_average” and type in the formula (which is the sum of the three subjects divided by three). Drag and drop the field names from the left panel (that shows the table column names as shown in Image 5), type the formula, check for the green tick mark at the bottom of the formula box to confirm. Once the formula is ready, save this new field and click on the DONE button to close this window.

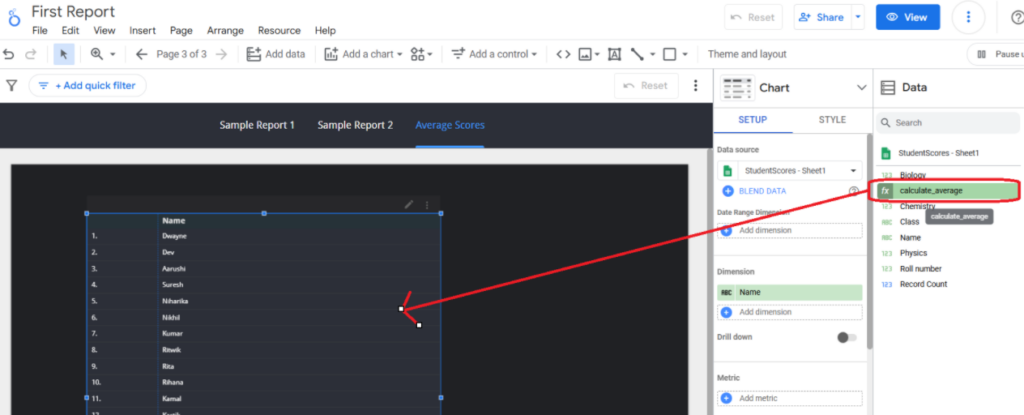
STEP 4: Look out for this new field in the DATA panel and drag and drop this field on the table that we had published in Step 1 (as shown in Image 6).
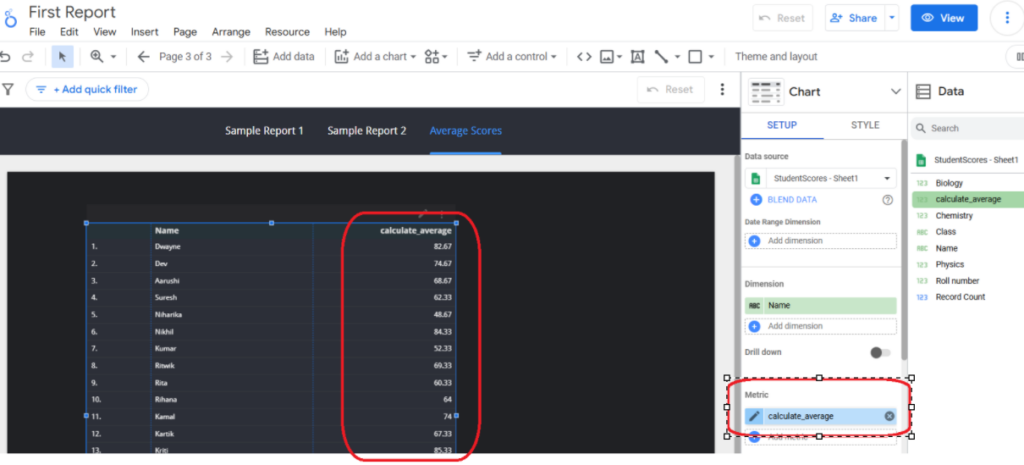
Alternatively, you can drag and drop this calculated field (which is now a metric field) on the Metric section under the SETUP panel. As soon as you finish this action, you will be able to view the average scores for each student in this table as shown in Image 7.
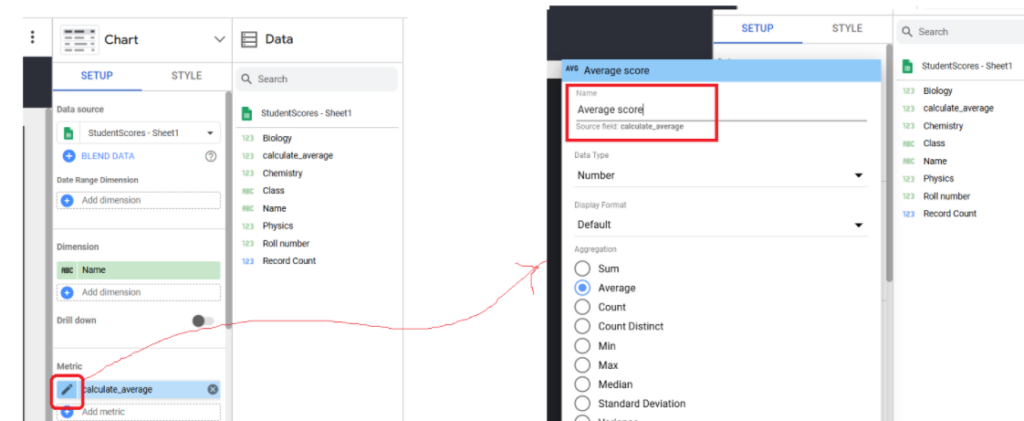
STEP 5: You can further edit this calculated field and reformat its display like naming the field name or formatting the display value. For this, hover on the left side of the calculated field name in the Metric section of the SETUP panel. You will find a pencil icon, click on that icon as shown in Image 8. A small pop up will come up wherein you can mention the display name and also try out on the other options on display.
Summary
One can add as many calculated (aggregated) fields as needed and refine the way the data is to be published. For our example, we were performing simple calculations, but the same action can be performed in multiple other ways too. Like for instance, we used simple “+” to add the field values and then used “/” symbol to divide the sum. Looker Studio offers many in-built functions that one can leveraged (refer Looker Studio Documentation) as well. Sharing some of the commonly used functions that even you can try out –
- concat(“Welcome”, field 1) -> concatenate field values
- sum(fieldname) -> add the values for the given field
- avg(fieldname) -> find the average for the values for the given field
- date(fieldname) -> extract the date value from the given field that has date and time components
- count(fieldname) -> counts the values in the given field name.
There are many such built-in functions that can be leveraged easily. And yes while building the formula, you can always look out for the green tick at the bottom of the formula box to be sure of the syntax.
Check out for the next blog on applying filters and drop down list controls in Google’s Looker Studio !!


