The last chapters (Chapter 6 – Dashboards and Chapter 7- JQL Queries) helped us to understand the process to generate dashboards and queries. Lets take a quick look on how do we link our saved queries (search results) with a gadget in Jira Dashboard.
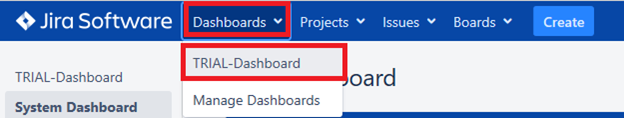
Step 1 -> Login into the JIRA and open your custom Dashboard “TRIAL-Dashboard” from the Dashboards dropdown menu.
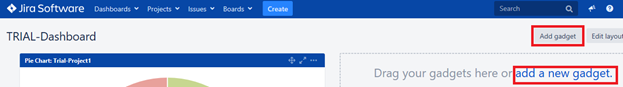
Step 2 -> Click on the “Add Gadget” button displayed on top right corner or on “add a new gadget” link displayed in the Dashboard screen.
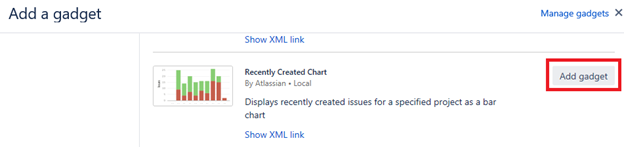
A window pops up prompting for the type of gadget to be inserted. Look for the gadget named ‘Recently Created Chart’ , click on the ADD GADGET option-
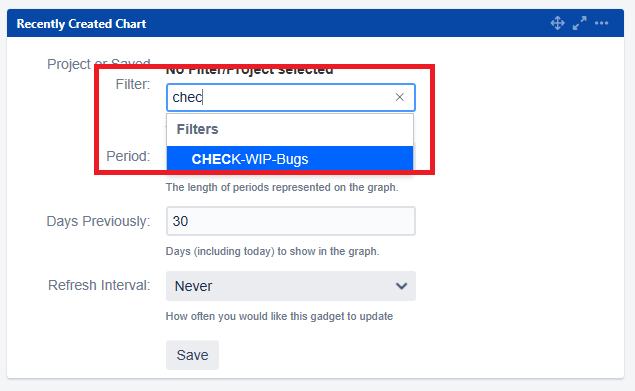
Step 3 -> Let us configure this gadget with the query that we had saved in the last chapter. From the drop down box, search for the query name ‘CHECK-WIP-Bugs’ as shown below-
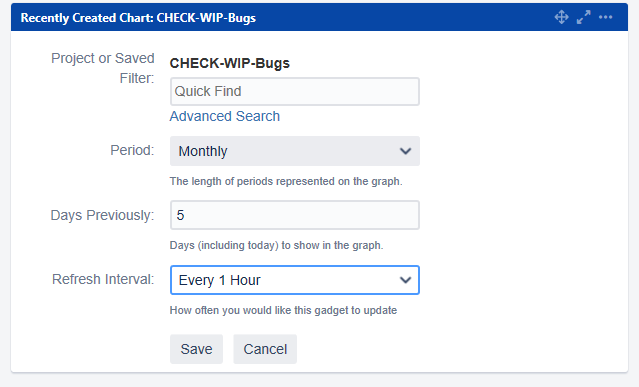
The other options that can be configured are the duration since past the data is to retrieved and the refresh interval range. Select the options as needed for your project. For this example, lets select that this gadget should be refreshed in every 1 hour and the consolidation is set on a Monthly basis.
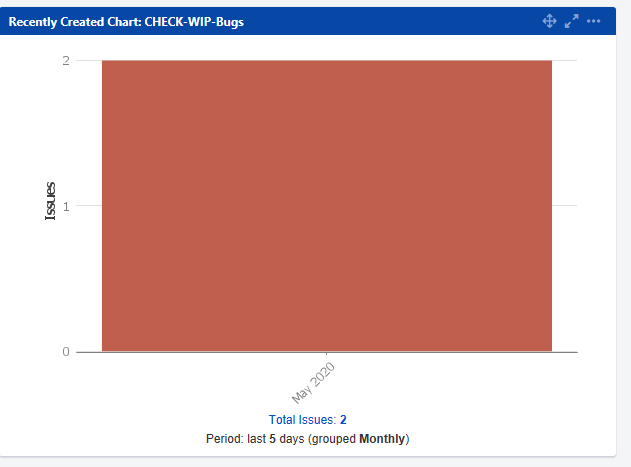
Click on the SAVE button, to view the gadget on the dashboard-
At any point in time, these gadgets can be dragged and dropped to a different place to adjust with other gadgets. Also, if you need to update the configuration of any gadget, click on the ellipsis “…” option on top right corner of the gadget and select the option ‘Edit’-
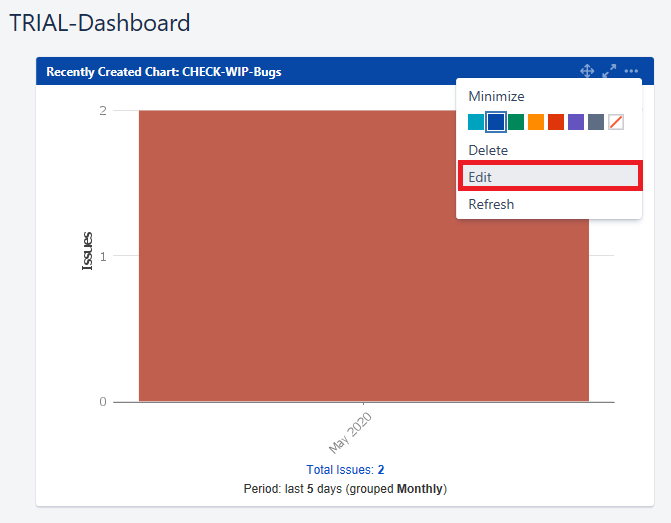
You can also change the color of the gadget panel and also if you want to remove the gadget, you can also do the same.
Try out for some more gadgets for your team 🙂