Some time ago, I had shared my viewpoints on some of the commonly used data visualization tools – Kibana, Grafana, Tableau; and am here again; this time talking about some more tools in the market – Power BI (business intelligence) and Google Analytics. Both these tools offer great insights into data but they address a different set of use cases. The Power BI tool from Microsoft helps users to create business reports; on the other hand, Google Analytics from Google helps users to analyze web traffic. So, if you have to make a choice between these two tools, then all you need to do is identify the purpose, I mean you need to know the use cases. Let us take a look at some of the interesting facts about these two tools –
| Tool Feature | Power BI | Google Analytics |
| Purpose | Business analytics | Web analytics, site performance |
| Application type | Web and Desktop | Web |
| Version | * Desktop version 2.40 * Service (web) version 13.0 | * GA 4 |
| Common use cases | * Data transformation (transform and clean data) from multiple sources like databases, XML, JSON, Excel, etc * Analyze real-time data points * View operational KPIs and other basic metrics | * Track user visits on a web/mobile application * Analyze bounce rate/ performance * View user behavior, operating system, geographical location, etc * Import Google Analytics data into BigQuery for enhanced analytics. |
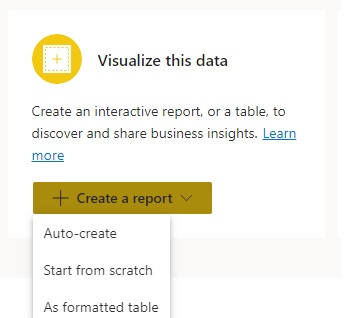
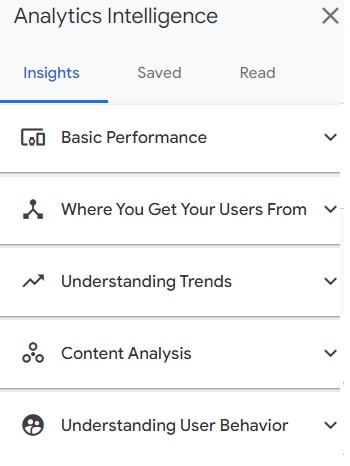
| Visualization options | Users can either create a report from scratch or just display data as a table or even leverage the feature called “Auto-create”- this feature generates reports automatically (AI-based) with some interesting widgets that helps users to visualize data instantly | Users can instrument the GA number in their application code or import data to analyze traffic. They can also leverage the “Insights” option to further drill down |
| References | Why Power BI – Features & Benefits | Microsoft Power BI | Analytics Tools & Solutions for Your Business – Google Analytics |
Both the tools offer other fantastic features like scheduling reports, setting up dashboards, exporting the reports and lot more. So, if you are looking for a tool that gets instrumented with your web application and helps you visualize the web traffic; then Google Analytics is great. And if you are part of the sales or marketing team or need to track KPIs (key performance indicators) or you need to extract data and transform it; then Power BI is a great tool.
Have you tried any of these tools? Which is your preferred tool ??


